
aMígo
Overview
About aMígo & My Role
aMígo simplifies the trip planning experience for social media users by pairing data from their profile, likes, and followed pages with our travel questionnaire to recommend the user’s perfect trip. aMígo generates a detailed itinerary that considers users’ personality, preferences, and interests. Thanks to aMIgo, those bucket-list trips will no longer just be a dream - they’ll be a memory.
As a UX researcher, I helped make plan for interviews, surveys, and testings, and took part in conducting them. After each research procedure, I helped summarize findings and insights for further improvements.
As a UX/UI designer, I created most of the digital and physical drawings including storyboards, wireframes, low and high fidelity prototypes and etc. I kept iterating design features and MVPs with translated the research insights and producing high quality outcomes.
Type
Course Project - Team work, UX designer, UX researcher
Team Member
Peihao Zhang, Alex Holder, Jialin Ye,
Jessica Fortunato
Date
October 2022 - December 2021

Research Procedures and Details
📕 Contextual Research
How might we personalize the trip planning experience for the travel-enthusiast who uses social media based on their profile, likes, followed pages, and demographics?
Goals & Questions:
-
Is social media influenced travel planning viable?
-
Will users change their previous travel planning behaviors?
-
Users will have trouble trusting an algorithm over themselves.
-
Will users feel violated (privacy concerns)? How willingly will the users be to share their activities on social media?
-
Users will feel shocked by how much data social media companies have?
-
Activities:
-
Participant recruitment
-
Directed storytelling & semi-structured interviews
-
Team debrief
-
Interpretation session
-
Affinity diagram
-
Model construction
Research Methods:
To better understand the problem space, we conducted contextual inquiry. Our goal was to discover if social media influenced travel planning was viable: Were people willing to break away from the traditional route of trip planning? What value would this add to the user’s life? In pairs, we intercepted four participants at the CMU Hunt Library coffee shop. All participants were undergraduate students.
We used the directed storytelling method along with a semi-structured interview. First, to spark their memory and provide evidence, we asked the participants to show us an image from a trip they took. We then prompted them to tell stories about that trip and several others to understand their process and preferences. During the semi-structured interview, participants were tasked with identifying their feelings towards a social media influenced itinerary through the use of an adjective sheet.
Insight #1:
College-aged social media users do not have extensive experience with trip planning.
Multiple interviewees suggest that they don’t often go on self-planned trips. The trip is usually planned by family, or led by a local friend. Our service can provide an easy introduction to travel because we handle the planning piece. This makes our value prop stronger. Travel customized exactly to your preferences without having to do any of the planning.

Insight #2:
There is an inherent skepticism and lack of understanding for what personal information social media algorithms collect.
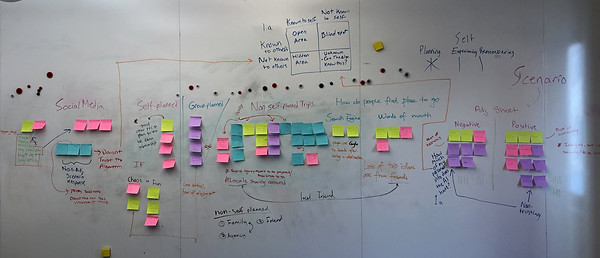
We heard users say that they would trust friends to plan their trip “over a computer”. This begs the question of whether friends, close or not, can truly know us on a deep level. They know the version of ourselves we project into the world. Does the algorithm go deeper? We used the idea of Johari Window to explore what we can perceive about ourselves and others. Algorithms can potentially uncover things that are unknown to users themselves.

Insight #3:
Some people prefer having control over travel planning while others prefer to have their trips planned by an outside source.
Our interviewees demonstrate various personal preferences over this topic. Our target market would be more adventurous and willing to go with the flow. Someone who needs complete control wouldn’t be a good candidate.

Insight #4:
Travelers want an authentic trip experience, and the picture versus reality issue is something we need to address.
Travelers want an authentic trip experience: shown around by locals, unique places, etc. Multiple interviewees mentioned how they planned places to go based on “word of mouth”, which tend to be more authentic. How to make suggestions on screen authentic is something that we need to explore.

Insight #5:
People use social media for inspiration but do not necessarily act on this further/involve social media in planning activities.
We hear a lot about how interviewees see cool stuff on social media but never think of doing the same thing themselves. People use social media for inspiration but do not necessarily act on this further or include social media in planning activities. This is due to limited budget, lack of time, and unpredictable expectations versus reality. These limitations also constitute our opportunities.

Summary:
We did an affinity diagram exercise to sort out interview information, and walked the wall together to notate insights of the affinity diagram.This process helped me learn how to group and categorize the information we gathered - there are a lot of ways to group things, it sometimes can get really messy and unorganized. But the process of walking through the information did give me a holistic view of the bigger picture, such as social media users’ common behaviors, the portion of non-self-planned trips, and etc.

📗 Speed Dating
Step 1: Walk the Wall

Step 2: Crazy 8's & User Needs

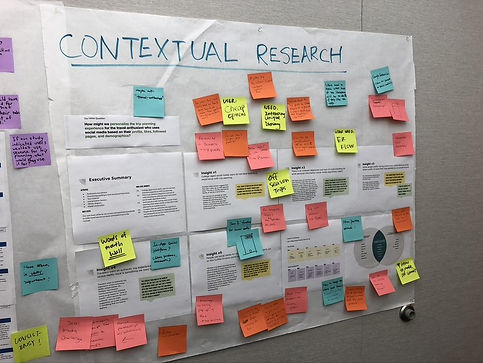
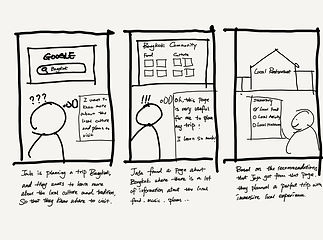
Our team did the crazy 8’s session in class and synthesized the results right after as a group. We also put user needs on sticky notes next to each sketch. After we identified all the needs, we vote on those options and chose four top needs, and created storyboards to address those top needs.
Step 3: Storyboards
01
I need to immerse myself in local culture.
Leading questions: Have you ever felt that you didn't really experience the places you visit?
Discussion questions:
-
How do you feel about the word "tourist"?
-
How do you feel about resorts?
-
Are you curious what life is like for locals in the places you visit? How could you learn more?
-
How would you feel if you were the main character in these storyboards?
-
What would be different about a trip if you spoke the local language?

Little Risk

Medium Risk

Most Risk
02
I need a sense of community.
Leading questions: Have you ever felt in need of support when planning a trip or on a trip?
Discussion questions:
-
Will you search information about local culture or tradition before going to a trip?
-
Do you plan a trip alone or with travel partners?
-
What do you use to search for local information?
-
Do you use group tags/keywords when searching, such as reddit groups?
-
What do you think about group trips? Good or bad? Challenges?
-
Attitude towards traveling with strangers?


Little Risk
Medium Risk
Most Risk
03
I need a way to understand and anticipate my travel partners' preferences.
Leading questions: Have you ever worried your traveling partners will prefer different things than you?
Discussion questions:
-
Do you ever go on trips with people you don’t know very well?
-
Have you ever experienced group conflict on a trip?
-
How important is it that you get to do what you want on a trip?
-
Do you prefer to travel solo or with partners? Why?
-
Would predicting/knowing what your travel partners' preferences are help you plan a trip?

Little Risk


Medium Risk
Most Risk
04
I need an easy, visual way to get inspiration for my trips.
Leading questions: Have you ever felt confused and overwhelmed by trip inspiration posts across various platforms?

Little Risk

Medium Risk
Discussion questions:
-
How do you feel about the word inspiration?
-
How do you feel about Expedia?
-
Are you curious about travel photos on instagram, or other social media? How could you learn more?
-
How would you feel if you were the main character in these storyboards?
-
What would be different about a trip if?

Most Risk
Step 4: Synthesis & Insights

-
People care more about who they are on a trip with rather than having control over what they get to do.
-
The need for immersion and authenticity is common but not shared by everyone. It’s also dependent on the context of the trip.
-
People look for trustworthy information and value others’ experiences when researching (word of mouth, reviews).
-
People are willing to take risks and travel with strangers, but they need to share an interest/hobby to motivate them.
-
People are also willing to travel solo and they view this as having different benefits and risks than a group trip.
-
People will consider positive algorithm recommendations, but they don’t want an algorithm preventing them from an experience.
-
People want a low-stakes, non-committal, visual way to browse trip options and refine their preferences.
📘 Survey
Goals:
-
Find out why people adopt new ways of doing things (social media apps)?
-
What characteristics of social media apps contribute to user retention?
-
What do they like the most and least?
-
-
How can our solution build trust/be viewed as an expert?
-
What level of data collection are people most comfortable with?
-
How frequently do people act on social media inspirations?
-
What makes them act on it?
-
What type of person acts on it?
-
Target Group:
College students on social media who travel for fun and vacation purposes.
-
College students are typically frequent users of social media, and they have a certain level of freedom/developing independence.
-
They may be more open to new experiences as they figure out their preferences.
Brainstorming & Pre-Test:
In sections, we were able to pre-test our survey with our peers. We got feedback on the clarity of our questions and overall survey structures. This was valuable because there were some blindspots that we were unable to see without peer evaluation. After debriefing with the team and implementing the feedback, we were more confident that this survey would uncover the desired insights.
Insights From Survey Responses:
-
Correlation - The two respondents who said ‘talking to new people’ was ‘interesting’ were the only two who had also been to more than 10 countries, with other respondents having visited less countries.
-
Correlation - The two respondents who said ‘talking to new people’ made them ‘anxious’ used social media the least out of all the respondents, with both answering that they use social media ‘3 - 6 times per week’. Interestingly, these were the only two respondents to select ‘TikTok’ as the platform they used most often. Both of their answers mentioned ‘distraction’ when asked ‘What do you like about the social media platform you use most often?’
-
6 out of the 8 respondents listed ‘do not use’ as a reason for deleting an app.
-
All of our respondents were between the ages of 18 and 25.
-
The two youngest respondents who were between the ages of 18 and 20 were also the TikTok users who found ‘talking to new people’ to cause ‘anxiety’.
-
3 out of 8 respondents reported that they purchased an item or booked an experience because they saw it on social media.
-
4 out of 8 respondents answered that they had visited a place because they saw it on social media and were inspired to visit.
-
Price and schedule availability are the most important factors when comparing trip options.
-
All of the respondents used social media at least 3-6 times a week, and half of the respondents used social media multiple times a day.
-
Most of the respondents (62.5%) expressed some level of concerns over the information collected from them.
-
Most respondents are open to purchasing something on social media and general recommendation.
-
All but one of the respondents had previously planned or taken part in planning a trip.
-
50% of respondents claimed that Instagram was the social media app they used most often.
-
Challenge 1: due to the small sample size of 8 people, the trend and correlation we are seeing now are subject to change and can be coincidental.
-
Challenge 2: For the open-ended question “What do you like about the social media platform you use most often?” We get all kinds of responses focusing on many aspects and they are not as converging as we might expect. For example, response includes good design, connecting with friends, clothes, good recommendation, entertaining, etc. It’s difficult to interpret such diverging open-ended responses.
Revisiting Goals For Survey:
-
What characteristics of social media apps contribute to user retention? What do they like the most and least?
-
Through the survey, we learned that respondents look for multiple aspects in a social media app: entertainment, communication, popularity, connectivity with friends, visual UI, messaging, e-commerce, and distraction.
-
Respondents typically delete apps due to low storage and low usage.
-
-
What level of data collection are people most comfortable with?
-
We learned that most respondents are slightly worried about the amount of information collected about them online. Those who weren’t worried either did not care or were unaware of the amount of data collected about them.
-
-
How frequently do people act on social media inspirations? What makes them act on it? What type of person acts on it?
-
50% of respondents have visited a place because they saw it on social media and were inspired. Along with this, five out of eight respondents were open to the idea of purchasing items or experiences off of social media. These respondents also answered “interesting, neutral, and awkward” to our question trying to determine extraverted and introverted behavior. There seems to be no correlation between this and acting on social media inspirations.
-
📙 Prototyping & Testing
Description:
This prototype task is the output of our survey result synthesis. One insight was that we need to better understand user attitudes towards the algorithms, specifically whether users trust algorithms broadly.
Tasks for AI Accuracy:
-
One group gets the correct recommendations
-
One group gets an incorrect recommendation
-
One group gets mixed (correct & incorrect) recommendations
Procedures:
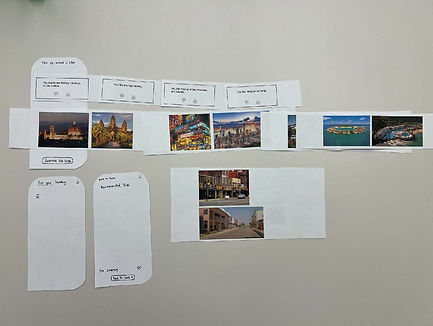
We built out a paper prototype that would be tested with three distinct user groups. We began by collecting the user’s trust score on algorithms generally as well as their Instagram handle. We then ask users to complete a short questionnaire in which users express preferences for travel destinations with a simple ‘thumbs up/thumbs down’ interface. After answering these questions, we collect their trust score for this algorithm’s results specifically. We then show the trip recommendation, ‘results’.
We did this to better understand how fine-grained and accurate our algorithm prediction must be for users to trust that the algorithm generates appropriate results.
Honest Signals:
-
We got the desired honest signals which reassure us that our product is viable as users are willing to provide their social media information and trust the algorithm at some level. There are a few improvements that could be made in order to increase the level of trust and satisfaction based on this prototype test such as expanding the diversity of trip options and increasing the level of details we provided.
-
In terms of value provided to stakeholders, our honest signals suggest that the level of precision of our AI algorithm does not have to be extremely high, which is easier to achieve and lower in developing cost in comparison to other algorithms which require more data and higher precision.

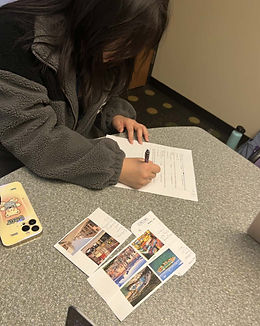
Findings:
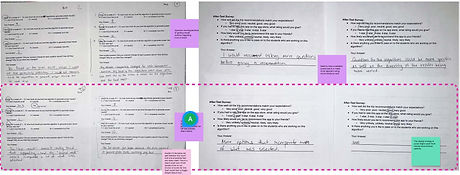
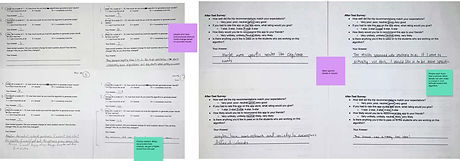
From the observation during the testing process, we found out that users' attitudes towards the algorithm did not change even if they got some recommendations that did not align with their interests.
After analyzing the results, we see a significant increase in users’ trust and likelihood to recommend our product as the accuracy of the given results increases. Meanwhile, while poorly predicted results lead to lower user satisfaction and trust, a blend of accurate and poorly predicted results still led to an increase in the level of trust at the end of our test. This is an interesting finding that we did not anticipate prior to this study which suggests that the algorithms don’t have to align with users’ preferences 100% of the time when giving recommendations for multiple trips.
Insights:
-
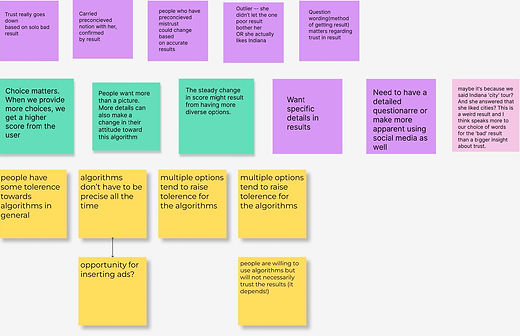
Choice matters. When we provide more choices, we get a higher score from the user. A single choice, no matter how good or bad, is not going to be satisfying to most users.
-
Users want to know about the details. While many of us thought that pictures could speak for themselves, participants generally want more information about the trip.
-
People carry preconceived notions with them. Users who generally trusted or distrusted algorithms carried these biases with them based on their previous experiences.
-
Method matters. Users paid specific attention to how we collected information on them i.e. commenting on the wording of questions and reflecting on their own self-image.
Lo-Fi Prototypes

Hi-Fi Prototypes


Survey Questionaire
Users feed their trip preferences to AI algorithm for future trip recommendations.
"For You" Feed
Based on users' preferences and likes on social media, aMígo will generate and recommend personalized trips.
Trip Itinerary
Personalized trip itinerary with extensive details and flexible options.
Link Social Media
Users can link their social media for AI algorithm to keep "learning" more about they might like for a future trip.

Previous Project

Next Project